Canvas, LCD monitor, temperature sensor,
each 24x14x3(cm),
2021
2020λ
, μ μΈκ³λ COVID-19 μ μΌλ³μΌλ‘ μΈν΄ λ§μ κ³ ν΅μ κ²ͺμμ΅λλ€. μ λΆμ κΈ°κ΄μ νν©μ νμ
νκ³ μ μ ν μ‘°μΉλ₯Ό μ·¨νκΈ° μν΄ μΌμΌ νμ§μ, μ¬λ§μ λ±μ λ°μ΄ν°λ₯Ό μμ§νκ³ μμ΅λλ€. κ·Έλ¬λ 'λ³΄λ€ μμ κ³ΌνκΈ°μ 'μ΄λΌλ λ―Ώμμ ββμ‘΄μ¬νμ§λ§, λ°μ΄ν°μ μ νμ±κ³Ό μ λ’°μ±μ λν΄μλ μ¬μ ν κ³ λ―Όν΄μΌ ν νμκ° μμ΅λλ€.
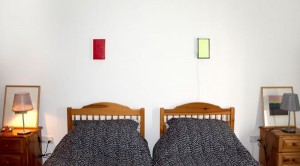
μΉ¨μ€μμ μ μλ νμ₯ νΉμ μ€μΉλ λ°μ΄ν°μ μ νμ±μ λν λ κ°μ μνμΌλ‘ ꡬμ±λμ΄ μμ΅λλ€. 'λ°μ΄ν° λ°λ€(2021)'λ νΉμ λλΌ, λ μ κΈ°κ΄λ³ μ½λ‘λ19 λμ νμ§μ λ°μ΄ν°μ μ°¨μ΄μ λ°λΌ κΈμμΉνκ³ κ±°μΉ κ² λ³λνλ©° λ³ννλ νλλ₯Ό λ³Ό μ μλ λΉλμ€ νλ‘μ μ
μ
λλ€.
'λΆμμ νμ§λ§ μ΄μμλ μ & μμ νμ§λ§ μ£½μ μ'μ μΉ¨λ λ²½ μμ μλ μΊλ²μ€μ μκ³Ό LCD λͺ¨λν°μ λ³ννλ μ μ
λλ€. νΉμ μ₯μ λ° μκ°μμ κ°μΈμ΄ μμ§ν μ¨λ λ°μ΄ν°λ€μ λνλΈ μκ³Ό, κ°μ μκ°, κ°μ μ₯μμ λ μ¨ μ¬μ΄νΈμμ λμ€μκ² μ 곡λλ μ¨λ λ°μ΄ν°λ₯Ό λνλΈ μμ ν΅ν΄ λ°μ΄ν°μ μ νμ±μ 무μμΈμ§ μκ°νκ³ μμΈλ¬ λ―Ένμ κ°λ₯μ±μ λͺ¨μν μμ
μ
λλ€.
In 2020, the world has suffered a lot due to the COVID-19 pandemic. Governments and institutions collect data such as daily confirmed cases and deaths to understand the current situation and take appropriate measures. However, the belief that it is βmore advanced science and technology is still there, but it seems that we still need to think about the accuracy and reliability of data.
The site-specific installation created in a bedroom consists of two pieces of artwork about the accuracy of data β βData Sea (2021)β, a video projection where one can see a soaring, fluctuating, and wide wave that is changing according to Covid19 data and βThe unstable but alive colour & stable but dead colourβ, two small works, one of which is a painting on canvas and the other is an LCD monitor.
Through the colours from data provided to the public on the weather websites and the data collected by individuals, we hope to have a chance to think what is the accuracy of data as well as explore aesthetic possibilities.
λΉλμ€μ λνλ€μ μ½λ‘λ19λ°μ΄ν°λ₯Ό μ 곡νλ κΈ°κ΄λ³ μ¬μ΄νΈμ μ½λ‘λ19 κ΄λ ¨ λ°μ΄ν°μ κ΄ν κΈκ³Ό μ€λͺ
λ€μ μ°¨μ© λ° μμ νμ¬ μ μλμμ΅λλ€.
In the videos, the conversation was created by quoting and addicting the introductory and explanatory text of the websites of institutions that provide COVID-19 data.

